If you've been following the news, you know that pedestrian safety, street infrastructure and changes to traffic patterns are all big subjects of spirited debate in Cincinnati right now.
Folks involved in those debates and other important decisions just got some more data to work with. But some academics say Uber and other companies should go further in their release of ride sharing data.
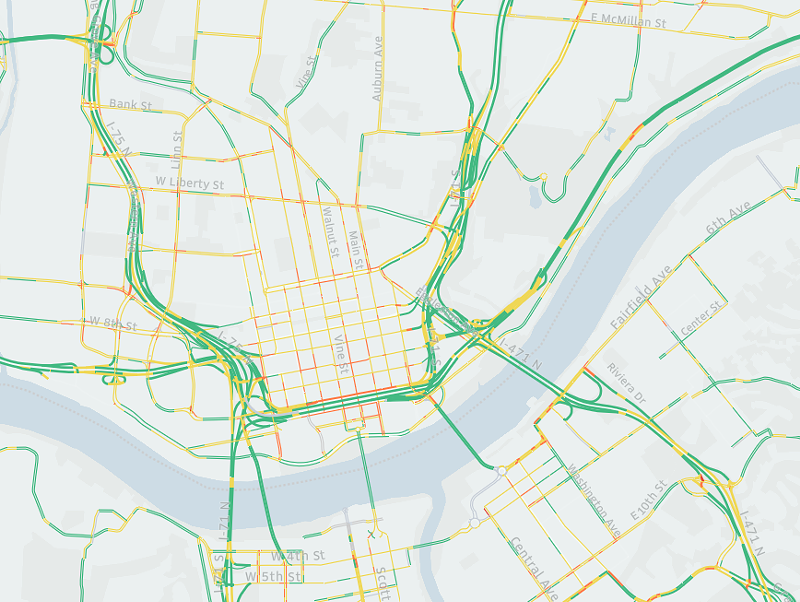
Greater Cincinnati is one of five cities across the world in which an arm of ride-share company Uber, called Uber Movement, is providing street-level data about traffic speeds it has gleaned from the many thousands of rides its drivers completed between Jan. 1 and Dec. 31, 2018.
The data comes via the Cincinnati Mobility Lab, a partnership between Uber Movement and the City of Cincinnati, the Ohio-Kentucky-Indiana Regional Council of Governments (OKI) and the Cincinnati USA Regional Chamber.
You can peruse the data via an interactive map available here. You can zoom in and see average traffic speeds on each side of each road for up to three months at a time — minus some less-traveled streets for which Uber Movement didn't have enough data — as well as how that speed deviates from what Uber calls "free flow" traffic. That's basically how fast traffic would be traveling if there was no traffic congestion on a particular street.
Let's say you wanted to know how fast cars traveled on average through non-intersection locations along Liberty Street — a portion of which will soon undergo a long-sought-after road diet. According to the most recent data available on the site, those speeds ranged from 34 miles per hour on the street's eastern-most side to 18 miles an hour on West Liberty Street near Central Parkway. As you might expect, speeds decreased near most intersections.
Another place that has dominated the news where Uber Movement's data is interesting is Hamilton Avenue as it passes through Northside.
The stretch of road has long been the subject of complaints about pedestrian safety. Attention to the street ramped up in 2016, when a car struck and killed local business owner Sarah Cole as she was crossing Hamilton Avenue. Since that time, other crashes have injured pedestrians in Northside's Business District.
Northside Community Council pushed for a range of traffic safety measures. One the city implemented was a traffic calming pilot program that allowed 24-hour parking along Hamilton Avenue's outside lanes. That program, which started in May 2018, has been extended indefinitely past its original June end date.
OKI has used the Uber Movement data as one metric to measure the effectiveness of the pilot, comparing traffic speeds from 7-10 a.m. and 4-7 p.m. in the five weeks before the pilot and the first five weeks it was in effect. Their analysis found that the pilot did reduce speeds in the northbound lane along some stretches of Hamilton Avenue during evening rush hour by as much as 5.6 percent, but seemed to have little effect at other times in other lanes. It's worth noting that a city analysis found a 39 percent reduction in crashes along the corridor during the pilot as well.
"The Uber Movement Speeds initiative addresses the increasing vulnerability of pedestrians and cyclists as they interact with cars and trucks," OKI CEO Mark Policinski said in a news release about the data. "It does this by providing an invaluable metric for evaluating traffic safety to local governments."
In addition to Cincinnati, Uber Movement has rolled out the data initiative in London, Nairobi, New York City and Seattle. The company says it plans to expand the program to other cities over time.
Not everyone is impressed with Uber's data initiative, however. Critics have dinged the company for refusing to release data about when and where people hail rides with its app — information they say is vital for city planners looking to mitigate traffic snarls. New research studying ride sharing in San Francisco suggests that in that city, ride sharing companies are large contributors to that congestion and increased traffic delays by 40 percent over a six-year stretch.
"After @uber is criticized for their lack of transparency, they release data that cities can easily get from @INRIX or @here instead," University of Kentucky Assistant Professor Greg Erhardt, one of the study's authors, tweeted. "That's not enough! Cities should insist on a reporting of TNC (transportation network company) trips at a Census tract level."

