Just as it’s getting colder in Cincinnati, a report analyzing the temperature of a summer day in August shows just how hot things become in the region’s “heat islands.” When mapped, these areas starkly overlap with lower-income neighborhoods and areas with larger Black populations.
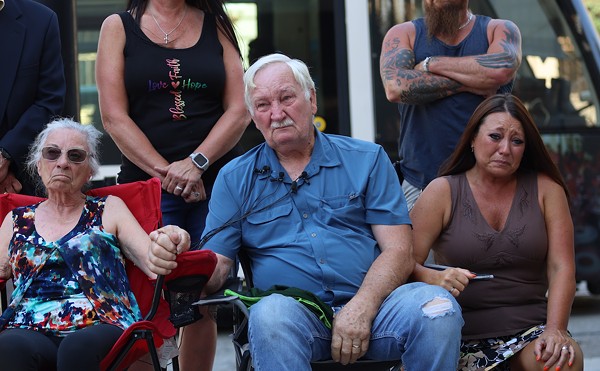
Conducted on August 10, the study relied on thermal sensors carried by volunteers who biked or drove along specific routes through Cincinnati, Elmwood Place, Lincoln Heights, Norwood and St. Bernard. Their findings came in the form of tens of thousands of location-targeted data points that tracked a day that hit a high of 89 degrees.
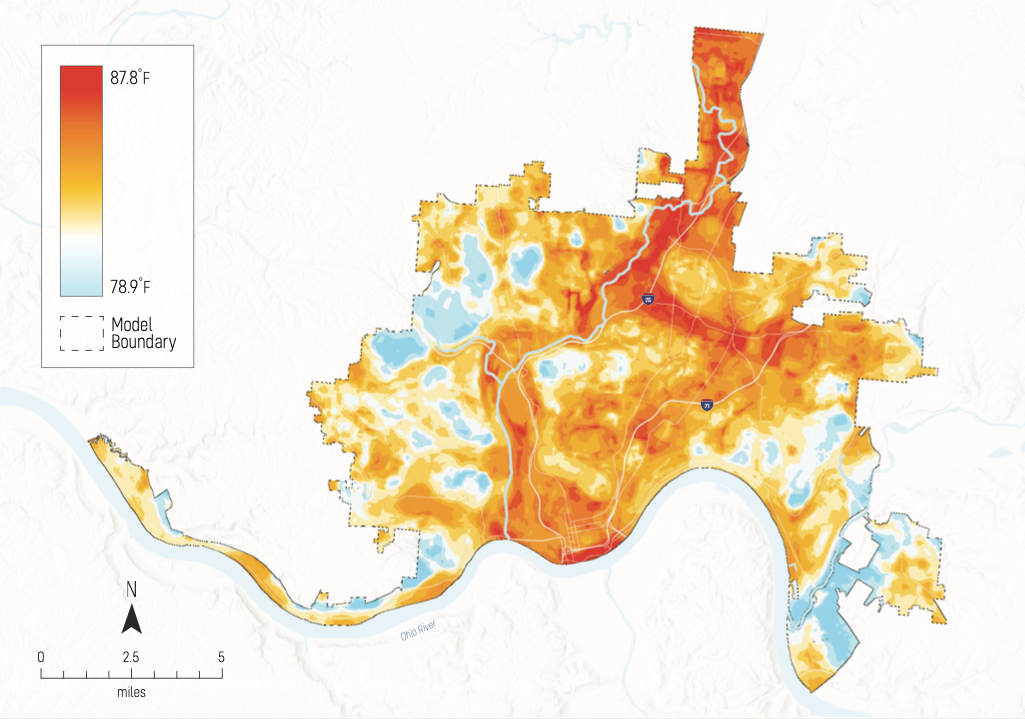
Funded by the National Oceanic and Atmospheric Administration's Climate Program Office, the study and resultant heat map for August 10 is “part of a regional effort to map where people are most at risk during extreme heat waves,” the city’s Office of Environment and Sustainability said in an email announcing the release of the report.
So, what did the researchers learn from a single hot day in August?
The report observed that large developments absorb and retain heat throughout the day, affecting even nearby residences. The region’s hottest areas featured roadways “with sparse vegetation,” the report noted, while tree-shaded neighborhoods “keep neighborhoods cool during summer heatwaves and lower the risk of heat-related illness for residents.”
In a press release, the Office of Environment and Sustainability said the data collected “will be used to inform strategies to protect our communities from heat emergencies.” Among possible solutions, the list includes opening more public air-conditioned spaces; removing or whitewashing large areas of black asphalt or dark roof surfaces; planting more shade trees; and “engaging in urban design to increase natural airflow through hot neighborhoods.”
The study found “pockets of heat” in Clifton, Clifton Heights, Corryville, Oakley and Northside. The press release also included an alphabetical list of the “hottest spots” in the region: Arlington Heights, Camp Washington, Carthage, Central Business District, Edgemont, Elmwood Place, Hartwell, Millvale, Lincoln Heights, Lockland, Lower Price Hill, Paddock Hills, Pendleton, Over-the-Rhine, Roselawn, South Cumminsville, St. Bernard, Walnut Hills and Winton Place.
While the report itself and press briefing describes the heat distribution as “inequitable” and “disproportionate,” the actual context of the imbalance is only hinted at. While tracking heat islands, the latest heat map is visibly similar to those that track the city’s demographics, household income, and history of redlining.
But the lack of a tree canopy in lower-income and urban neighborhoods is not an uncommon issue.
In 2018 the city passed a version of the Green Cincinnati Plan with components woven throughout to help the city adapt to changes in weather patterns and equity efforts to attempt to keep the city’s most vulnerable residents from bearing the brunt of the burden. One of the major resiliency recommendations: increase the city’s tree canopy to shield communities from ever-increasing heat in the summer and to soak up water from those massive rainfall events.
Per a new report from the Cincinnati Park Board's Division of Natural Resources, the city has 38% canopy coverage — the regional goal is 40%.
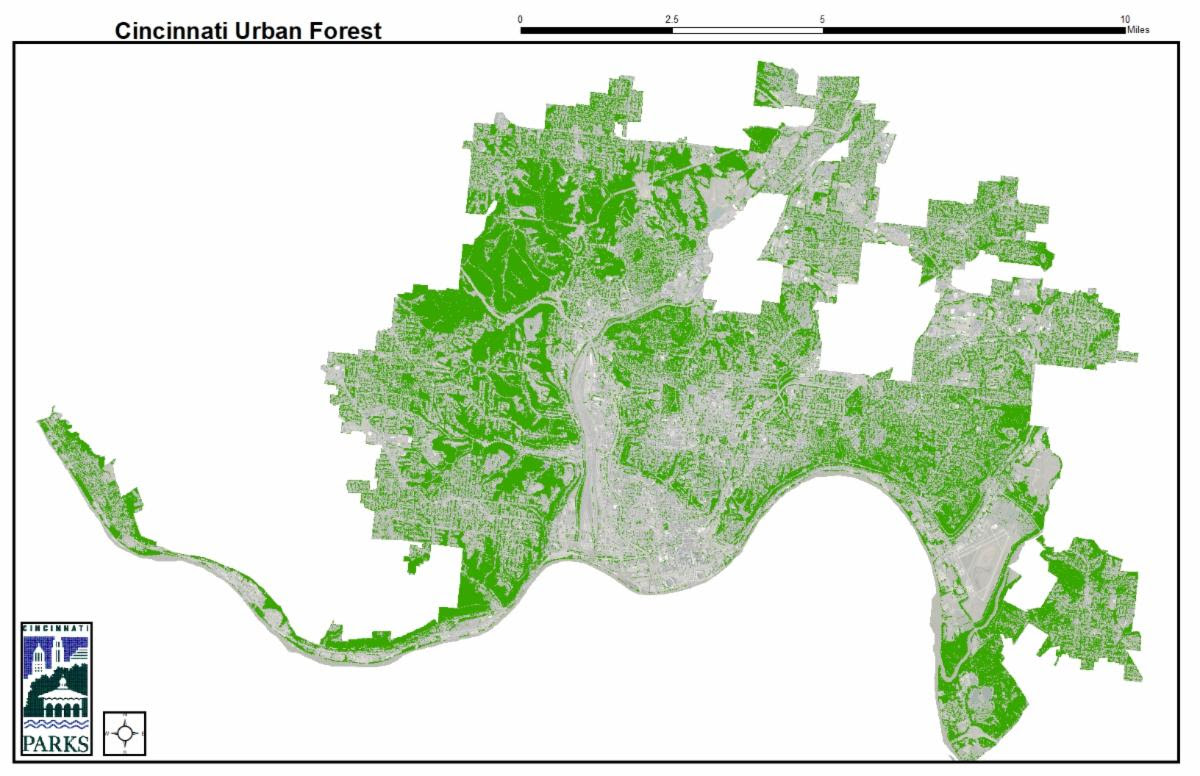
Cincinnati Parks has received grants through the Ohio Department of Natural Resources to monitor canopy coverage every 10 years and contract geospatial services.
"In Cincinnati, this information has been used to guide focused planting efforts where trees would be most beneficial to address environmental issues like excess heat and storm water. 2020 will represent the third iteration of this work," reads a release.
This data will be overlaid with the new heat island information as well as "demographic information from the 2020 Census, and a detailed analysis of air quality issues, such as PM 2.5 - the lead cause of increased asthmatic rates in urban communities."
"Taken together, this information will be put to work to develop and implement targeted planting plans in communities with the greatest need," the Parks release reads.
As the maps suggest: If you are a Black or low-income resident of Cincinnati, you’re probably overheated as well.