In November last year, Sheron Kidd found herself in a very difficult situation: a new owner wanted to renovate her rented home in Walnut Hills, but she and her neighbors were finding it hard to secure new housing nearby.
The situation became tense, and eventually Kidd and her neighbors say the landlord was threatening evictions if they didn’t leave their townhouses on Kenton Street. At the last minute, the residents found places to live and avoided the painful process of being formally evicted from their homes.
But many others in Kidd's neighborhood — and Cincinnati as a whole — haven’t been so lucky. There were more than 4,000 evictions in Cincinnati in 2016, data shows.
That's a big deal, because housing instability can cause any number of other problems with employment, mental and physical health and lost social ties, and because eviction is often a dark mark on a person's rental record that can make finding housing harder in the future.
"The move really took a lot out of us and we still haven't completely unpacked yet," Kidd said after finally securing an apartment in Price Hill, where she's living with her daughter and newborn granddaughter, born just before their move out of Walnut Hills. "This place is more of a strain financially than our previous place, but we're managing."
Evictions displaced more than 30 people a day in Cincinnati in 2016, according to data from Princeton University’s new Eviction Lab, which tracks the legal removal of residents from rental homes. Fourteen Cincinnati Census tracts have an eviction rate higher than 8 percent — a huge five and a half points above the national rate.
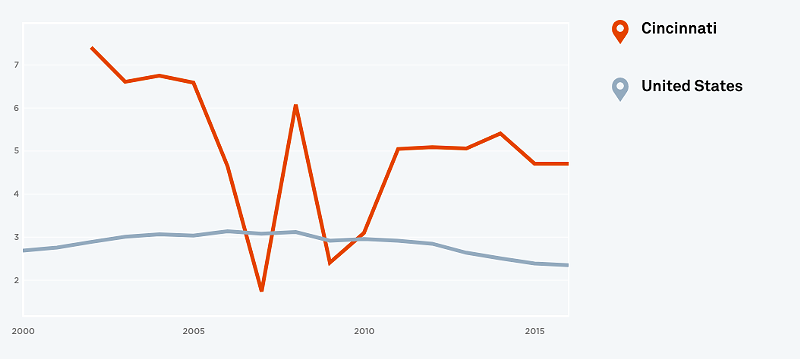
The city as a whole had a 4.7 percent eviction rate in 2016, more than two points above the national average, according to new data from the Eviction Lab. The first-of-its-kind lab and database are run by Princeton Sociologist Matthew Desmond, who last year won the Pulitzer Prize for his book Evicted tracking America’s growing housing crisis. Cincinnati has generally had a higher rate of eviction than the nation as a whole.
Nationally, Desmond's past research suggests that black renters, especially black women, are hit especially hard by America's eviction crisis. Predominantly black neighborhoods show up on Cincinnati's list of neighborhoods with the highest eviction rates, but so do predominantly white neighborhoods. The tracts generally have one thing in common: a median household income well below the city’s $35,000 a year median.
The Census tract where Kidd and her neighbors used to live, tract 267, had the 10th-highest eviction rate of Cincinnati’s 129 Census tracts in 2016.
Kidd and her neighbors’ informal evictions happened due to housing redevelopment, but there are a number of factors that can cause someone to be evicted — loss of a job, inability or unwillingness by a landlord to keep a building up to municipal code, violation of lease terms, and so forth.
According to the data, the tract containing Kidd’s former home in Walnut Hills saw 48 evictions in 2016, giving the neighborhood a roughly 8.8 percent eviction rate. Eviction Lab arrives at that rate by comparing the number of actual evictions carried out in each neighborhood with the number of available rental units in a particular neighborhood.
Other Cincinnati neighborhoods have even higher rates. A number of tracts in the Price Hill neighborhoods are high up on the list, including Census tract 93 in East Price Hill, which had the highest rate in the city in 2016.
The trends aren’t static. In 2011, for instance, the tract containing Kidd’s former home saw roughly half that number of evictions and had just a 5 percent eviction rate. Nearby neighborhoods, like the two northern Census tracts in Over-the-Rhine, meanwhile, had rates at roughly 9 percent that year. The rates in that neighborhood have fallen as tract 267’s rate has risen.
"I honestly don't know that anything would make it better," Kidd says. "The city knows what the problems are, but it doesn't seem to be a concern. It seems like they've focused on bigger things in the past few years... casinos, downtown entertainment, lager houses, streetcars and now a stadium. It's evident they aren't concerned with the homeless, so how can we expect them to have any empathy for the involuntarily evicted?"
Policy experts suggest a number of strategies to avoid evictions and keep people in their homes. Those include building more affordable housing, intervention for those who have been evicted to get them back into housing quickly, and better data on who is evicted in America.
Here are Census tracts with the highest eviction rates in Cincinnati in 2016:
• Census Tract 93 (East Price Hill) — 13.15 percent eviction rate, 98 evictions
• Census Tract 28 (Camp Washington) — 12.71 percent eviction rate, 52 evictions
• Census Tract 85.0 (Mount Airy) — 12.47 percent eviction rate,150 evictions
• Census Tract 100.02 (Westwood and East Westwood) — 12.21 percent eviction rate, 227 evictions
• Census Tract 103 (Sedamsville) — 11.8 percent eviction rate, 36 evictions
• Census Tract 94 (East Price Hill) — 11.47 percent eviction rate, 46 evictions
• Census Tract 98 (West Price Hill) — 10.77 percent eviction rate, 66 evictions
• Census Tract 95 (East Price Hill) — 9.74 percent eviction rate, 57 evictions
• Census Tract 272.0 (Lower Price Hill/Queensgate) — 10.14 percent eviction rate, 67 evictions
• Census Tract 267.0 (Walnut Hills) — 8.78 percent eviction rate, 48 evictions
• Census Tract 263.0 (Queensgate/Lower Price Hill) — 8.6 percent eviction rate, 24 evictions
• Census Tract 69 (Avondale) — 8.42 percent eviction rate, 76 evictions
• Census Tract 269.0 (West End) — 8.11 percent eviction rate, 79 evictions
• Census Tract 97 (West Price Hill) — 8.05 percent eviction rate, 103 evictions


